Algo Breakout : Spotting Higher time Frame Breakouts in Lower time frame charts
Posted on July 26, 2019 12:03 pm
Lot of traders assume that a Breakout is a high profile event and they need a big candle above or below a level with huge increase in volume for it to be successful. Not necessarily. These days we have More Algo traders coming in, these algos are dependent on price. So you will see more subtler breakouts. Subtler Breakout is a breakout in whcih prices move down without creating any big bars in charts . This is done to reduce slippages. Thru Price Action you would be able to spot Algo program buying and selling. In My previous blog I have mentioned about how we as retail traders can’t move the market from one point to another, but collective institutions known as the SMART money traders can move the market. As a price action trader our job is to find which direction the smart money is placing the trades.
If you have missed the previous blog click the link below and then continue this blog...
http://www.technicaltrader615.com/price-action/smart-money-momentum-trades
Markets have evolved, means no longer the same strategy will work without adjustment. Only if you know price action and market structure you will be able to do that adjustments.
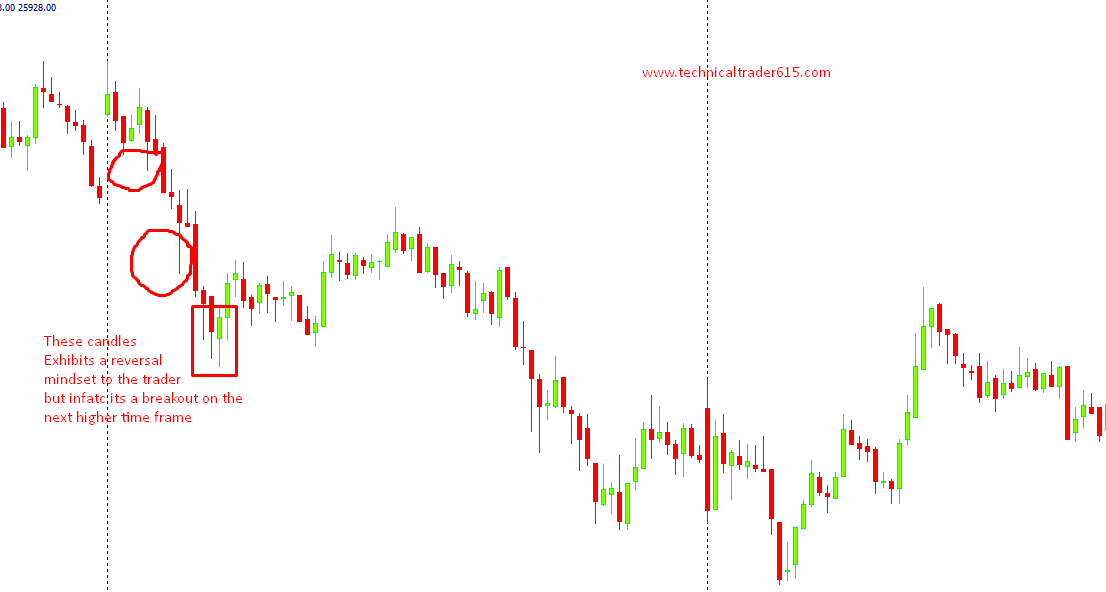
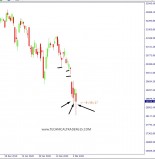
See the Example below : The area Marked in red actually exhibits as if prices are going to reverse with tails or not a sign of good bear stregth and bad follow thru bars for bears. Halting lot many traders to Enter short trades thereby reducing slippages for the institutions. Smart money use this kind of algorithms to prevent lot many retail trader to enter. But infact it is a Breakout on the next higher time frame.
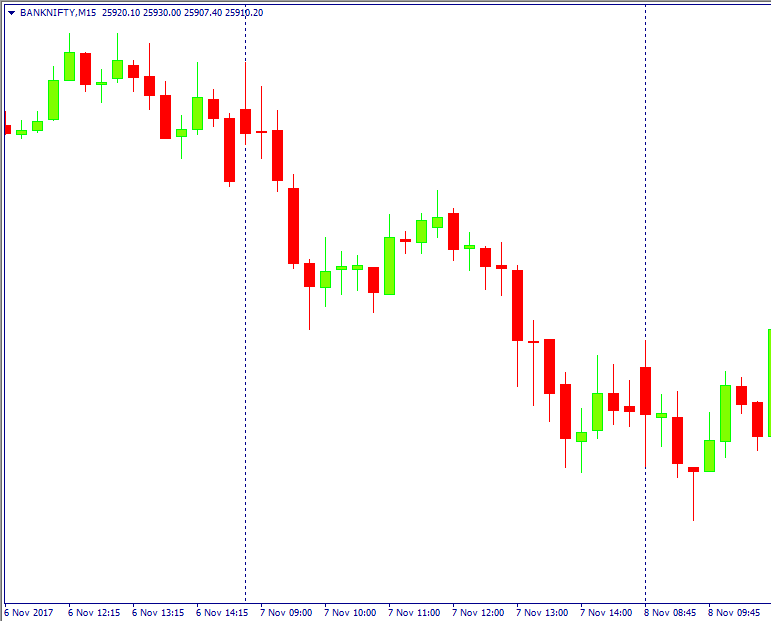
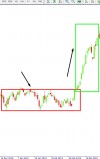
Looking at the 15 min chart of the same , You can see a breakout bar and a follow thru bar signifying more downside movements to follow.
How do we spot these subtle breaks ?
There are better ways , but to keep it quick within the scope of this article I am giving you an easy way. When you see continuous movements and you see candles moving down without breaking the high of the previous bar by 1 points( in case of down move). (Look at example image 1 to understand this point. )That indicates selling pressure. In other words this indicates a break bar and follow thru bar is forming in the next higher time frame. Similarly for bull break in lower time frame see if a new candle is not crossing the low of the prior bar to know if this is a higher time frame breakout. When you can spot higher time frame breaks in lower time frames your Risk Reward will increase phenomenally.
for more details on reading charts without indicators and to trade thru core price action take my price action course one to one online and trade live with me for 6 months. You can call / watsapp me @ 7373339777 or 8508777733 for more details
Happy Trading and Learning !!!
Cheers....
Comments
Leave a Reply
Your email address will not be published. Required fields are marked *

No comment has been posted yet.