Identifying Breakout Failure using Price Action
Posted on June 12, 2018 12:18 pm
Identifying Breakout Failure using price Action.
A Breakout is a strong move in a single direction. There are some times when all the conditions for a Breakout is good, yet the setup fails to continue in the direction of the breakout. The breakout could be because of any pattern like Head and shoulder or channel break or could be based on news also. But the Validity of the Breakout can be measured only Via Price Action. Price Action goes into the depth of the market structure and Order flow to understand the moves behind it.
In the Earlier article on Smart money Trading, posted I have written about the Collective FII Orders which helps in generating momentum in the direction of breakout. Same Way the Absence of Instituion Buying ( FII / DII) can be found using Price Action, Means you can identify the lag of momentum and manage your trades accordingly rather waiting like a sitting Duck and let your Stop loss hit. Here i will explain a basic price Action tactic.
A strategy is different from a Tactic. Strategy is the whole trade plan while tactic is the Trade Management Adjustment you do during the Live Markets.This is where Price Action knowledge makes a difference.
Lets discuss the Example now:
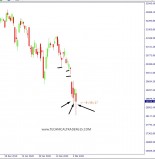
A Bar which breaks is called the breakout bar and the bar which we enter the trade is called Entry Bar. Now after the breakout most traders enter on the Pull back. If this Entry bar is getting rejected on the opposite direction of the Trend then we know the momentum is on the opposite side. The Conditions are give below in detail.
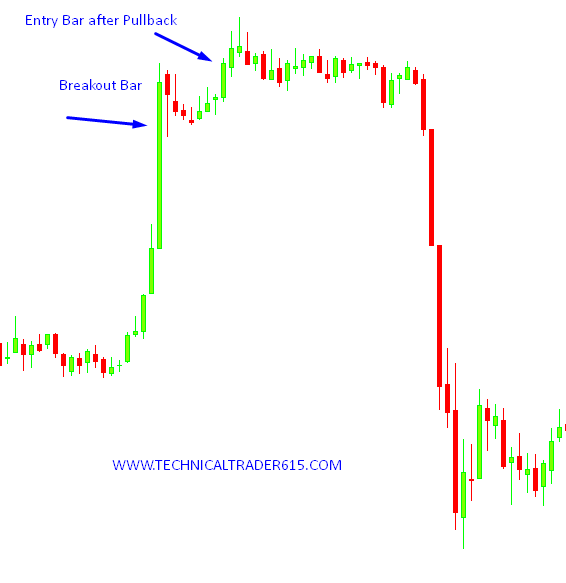
1) First thing is to note the Absence of follow thru candle. We had 2 green bar after entry and both the bars had significant tails.
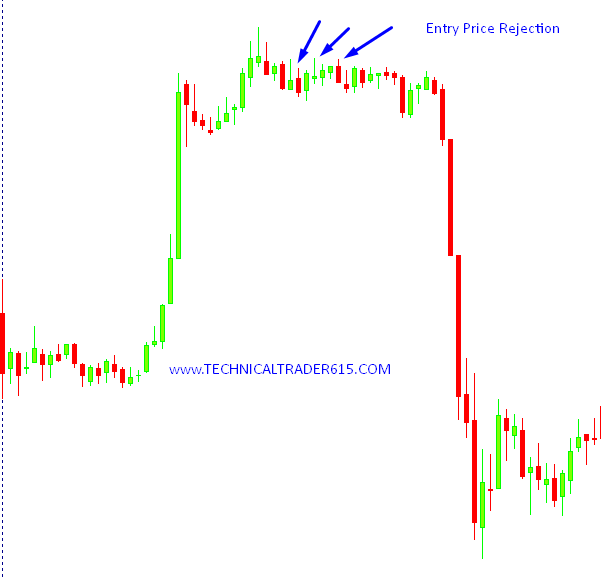
2) If you draw a horizontal line in the entry bar and if you see when candles comes to that level and you see tails , that means bulls are exiting @ cost. You can see the image below
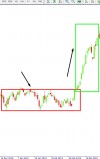
3) If price candle stays in the same area for more than 20 bar you can be sure now the bullish momentum has dried up.
4) The final nail on the coffin is the Decent red candle which formed, where you exit longs and can go short as there are no buyers coming at higher levels.
. I discuss much more in detail in my One to one price action course where we learn and trade Live in the market together. Join my one to one price Action course and Trade LIVE with me.
You can call / watsapp at 7373339777 / 8508777733 for any queries.
You can click the below link and Read the Article Titled Smart Money - Momentum Trades
http://www.technicaltrader615.com/price-action/technical-chart-analysis
Happy Learning and Trading..
Cheers !!!!
Comments
Leave a Reply
Your email address will not be published. Required fields are marked *

No comment has been posted yet.