How to Identify Low Volatile and Choppy days
Posted on August 02, 2018 02:36 pm
A trader makes money only if prices move up or down from the current market price. To ensure good price movement a day trader must choose volatile instruments. I personally trade the Bank Nifty because it generates the neccessary movement to get in and get out.If prices are not moving anywhere no body gets to make money. It will be a waste of Brokerage, taxes and time.
To Identify if certain instrument like stocks or index is good to trade you should know the historic volatility per day. It is very easy. You can go to NSE and download the Open, high , low, close of the last 1 year of any instrument. You can use the below link or Export your chart data.
https://www.nseindia.com/products/content/equities/indices/historical_index_data.htm
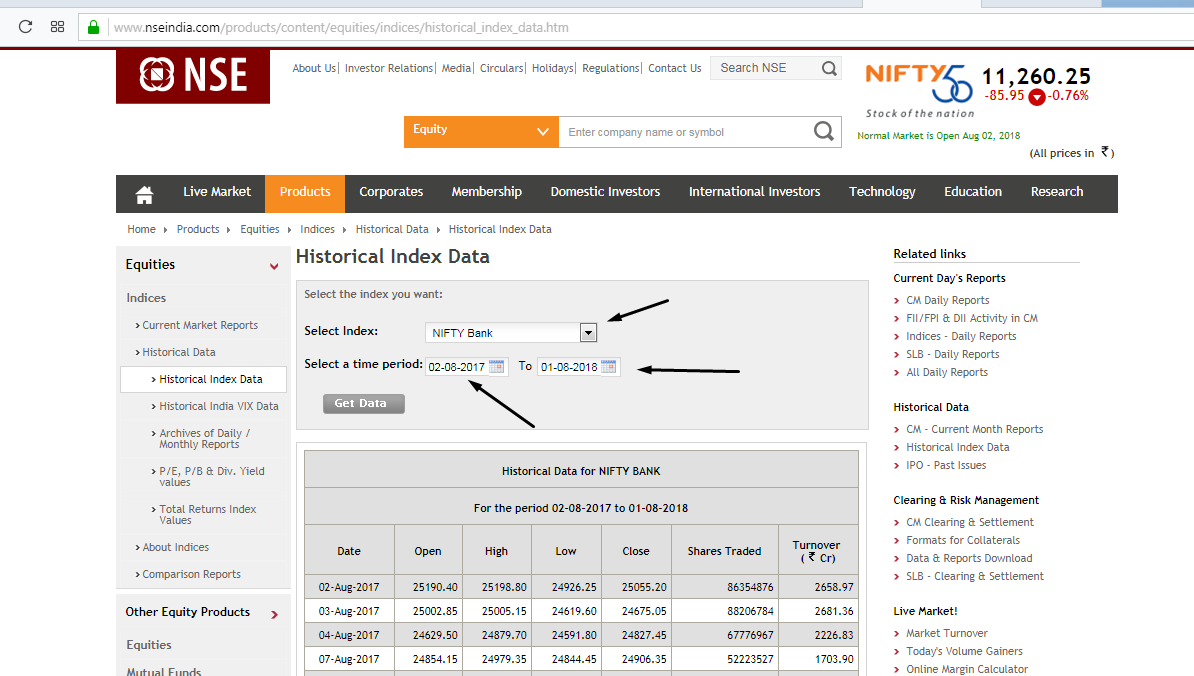
you are allowed to download upto 365 days of data in NSE india website. Select from and to date and download as .CSV. Now take high - low and divide by the number of days to calculate Average Volatility of any instrument. Bank Nifty gives a high - low of approx 285 points per day. There was times when it used to have a average high -low close to 400.
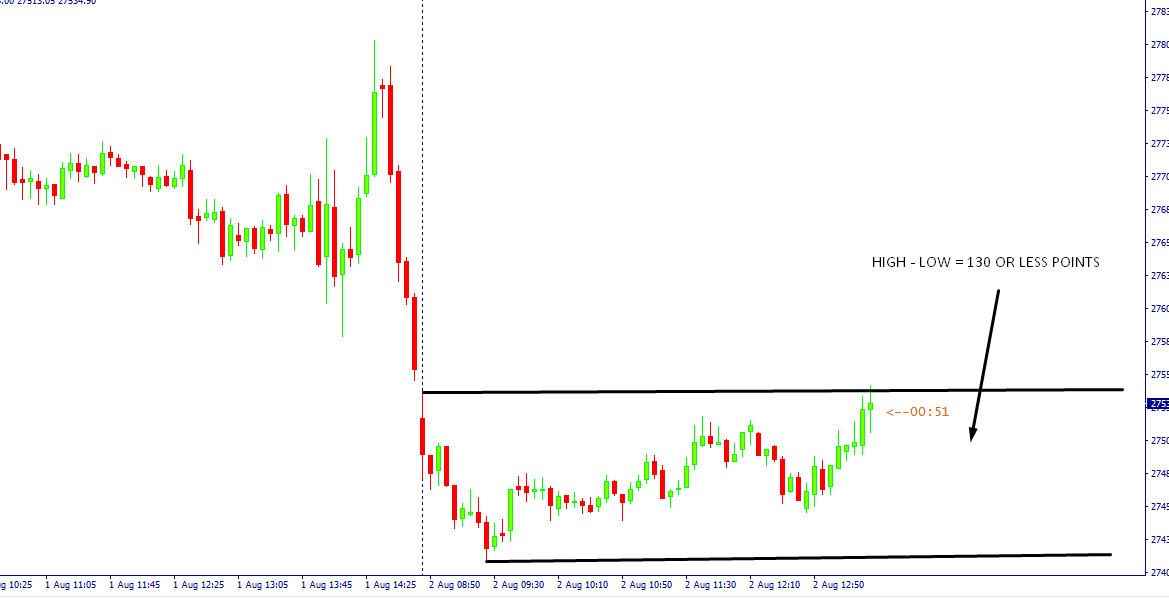
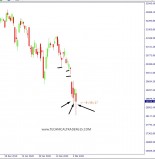
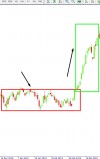
Take todays Bank nifty chart , the High - low is 130 points till now and only 1 hour left for the market to close. Now we can say that now banks are choppy or not good to trade. But how to identify in the early hour. Simple. you can divide the market into Opening Range, Mid afternoon range and Closing range. Use the opening Range high - low of Bank nifty , that gives an average of 160 points. you can calculate this like we calculated daily range. I take an average opening range of 1 hour , and this would be calculated on recency basis. If Banks High - low fails to cross 160 points in the open hour, the probability of prices being in a trading range is much higher than trending condition. So i can structure my trades accordigly. As i know if its a low range day, the targets are also going to be small and mostly choppy. And this is what market did today. You can see the example attached below. This coould save lot of points for you.
Few days back i put a status in FB as "Trading is not about a strategy, its about a traders ability to execute a trading system". Well a system should have all these conditions factored into it with money management, position sizing, etc;
I teach one to one Advanced Price Action Strategy to trade the markets in detail with Live Market Training. All strategies are backtested to give you a positive output. If you are interested you can call / watsapp to 7373339777 or 8508777733.
for more articles click the link below
http://www.technicaltrader615.com/price-action/technical-chart-analysis
Happy Learning and Trading.....
Cheers !!!
Comments
Leave a Reply
Your email address will not be published. Required fields are marked *

ManojAugust 02, 2018 at 04:26 PM
**divide the market into Opening Range, Mid afternoon range and Closing range----where in NSE is this data available
AdminAugust 13, 2018 at 11:53 AM
You can Export your chart data