Exhaustion Bar trade Strategy in Bank Nifty today with trade Details
Posted on April 23, 2018 12:19 pm
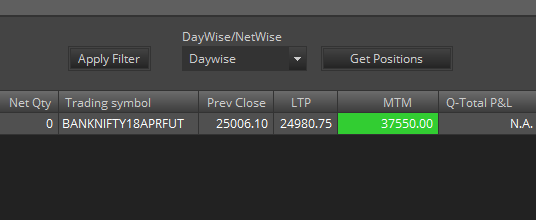
As a trader you should be able to read price movements. Price action tell you the difference between a good breakout and a bad breakout. for example today April 23rd 2018 in Bank nifty the open candle was 200 points long and was a good Red bar, Most indicators would have shown you Heavy Sell. But price action told that it was an Exhaustion. This Simple piece of information could not only saved your losses but also gives you profits. I have attached my todays trade and also have explained how to read Exhaustion. I Teach one to one price action course where i discuss in detail on different price action strategies for both intraday as well as positional. if you are interested kindly get in touch thru watsapp or you can call me at 7373339777 or at 8508777733
How to trade Exhaustion Bars ?
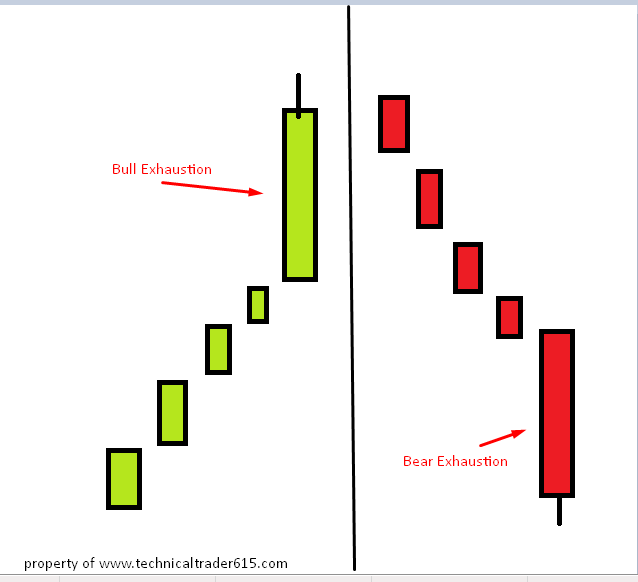
Exhaustion bars are more than average size or very huge bar which comes late in a Trend. In a Bull condition if we get a Bull Exhaustion Bar, it signifies that the last Buyer who wanted to buy have bought into and no new buyers are left to push prices forward
The Sellers knew there are lot of trapped new buyers and the Trend is pretty Matured, this is where counter trend traders set in
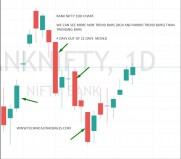
An Example of How a Bull Exhaustion and bear Exhaustion looks like is show below
The Exhuastion concept works across all time frames according to the Trend size in that time frames. The Conditions required are:
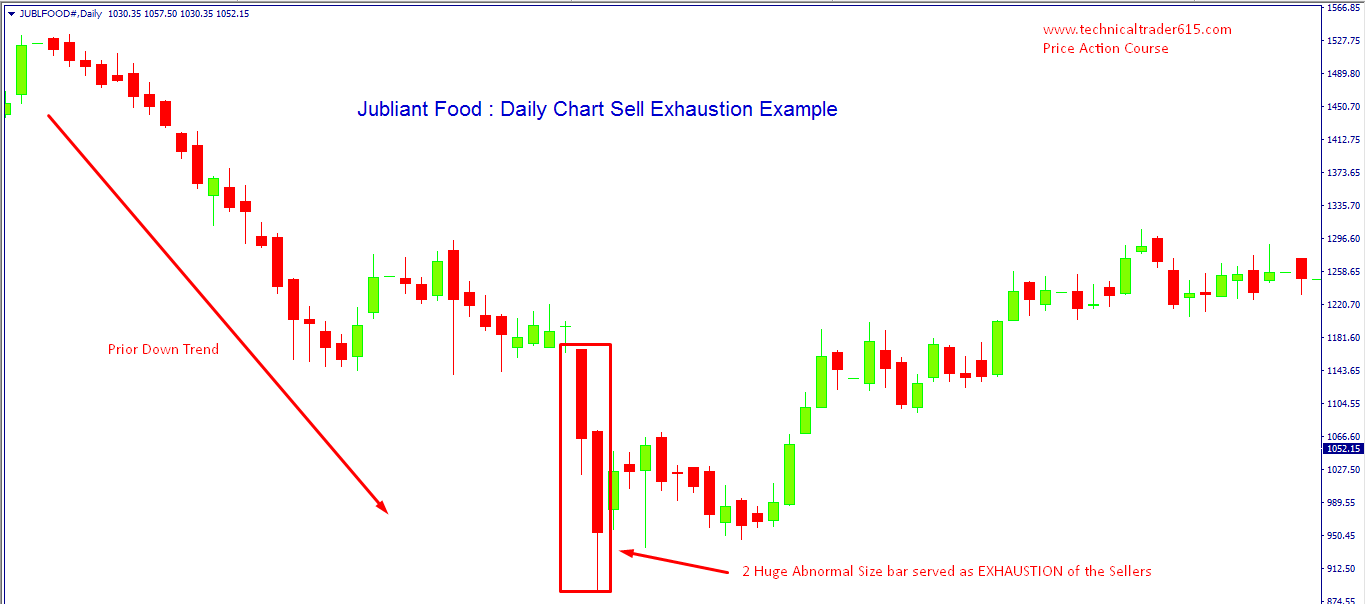
- Prior Extended Trend
- Huge Bar at the last
- Extended Volatility ( with Tails or without tails doesn’t really matter)
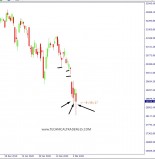
The Trade is taken when prices take the low of the bull exhaustion bar and high in case of bear exhaustion bar
The example below will help you understand better.
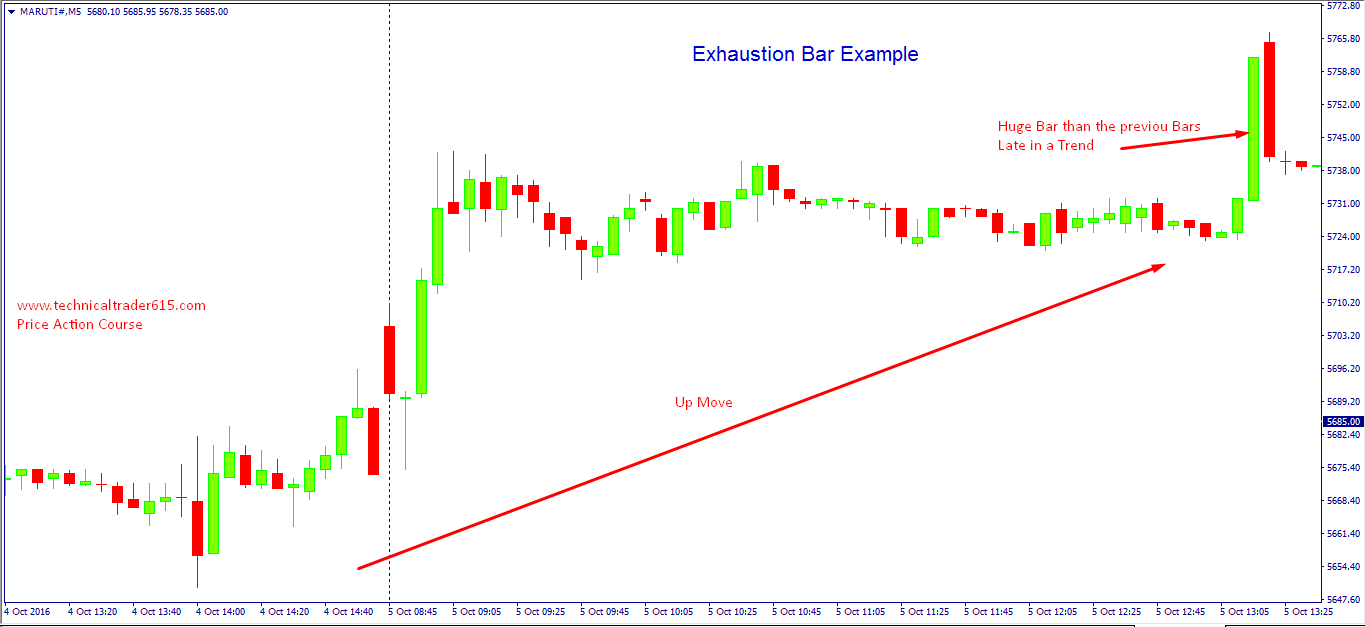
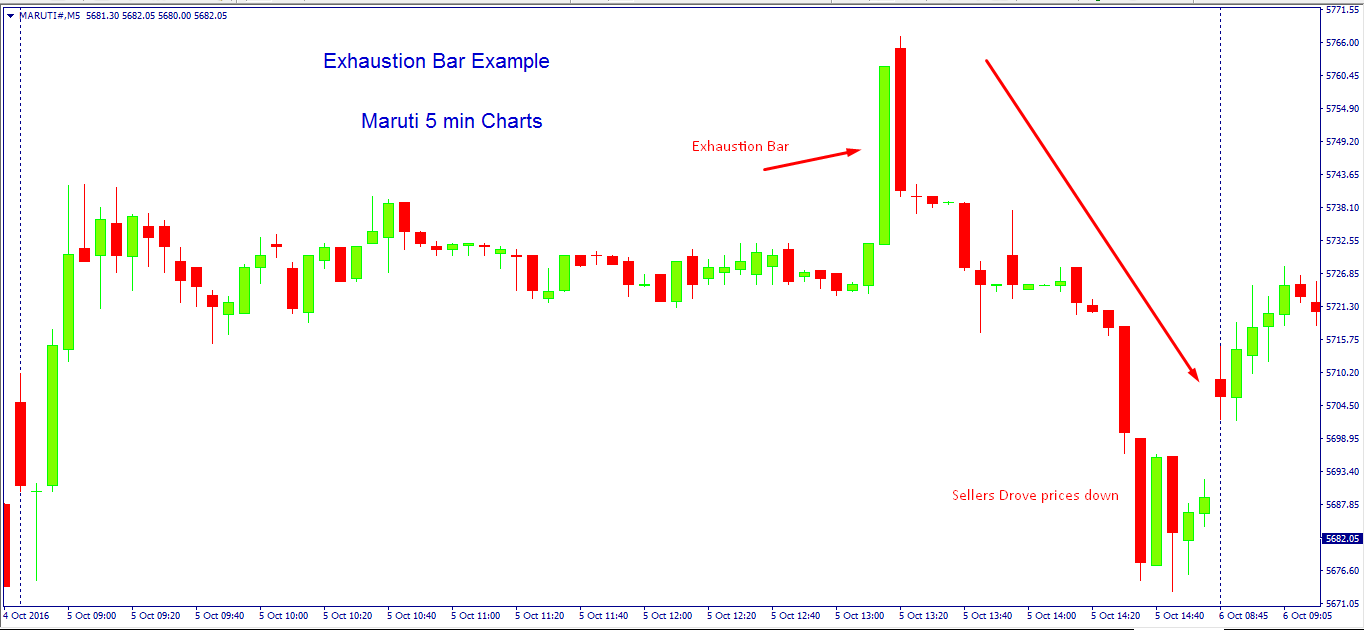
This is maruti 5 min chart, We have all conditions like listed above and the Entry is below the low of the Big Bull Bar.
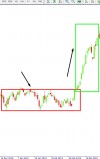
One more example from my favourite Stock: Jubliant food : Daily Chart Time Frame
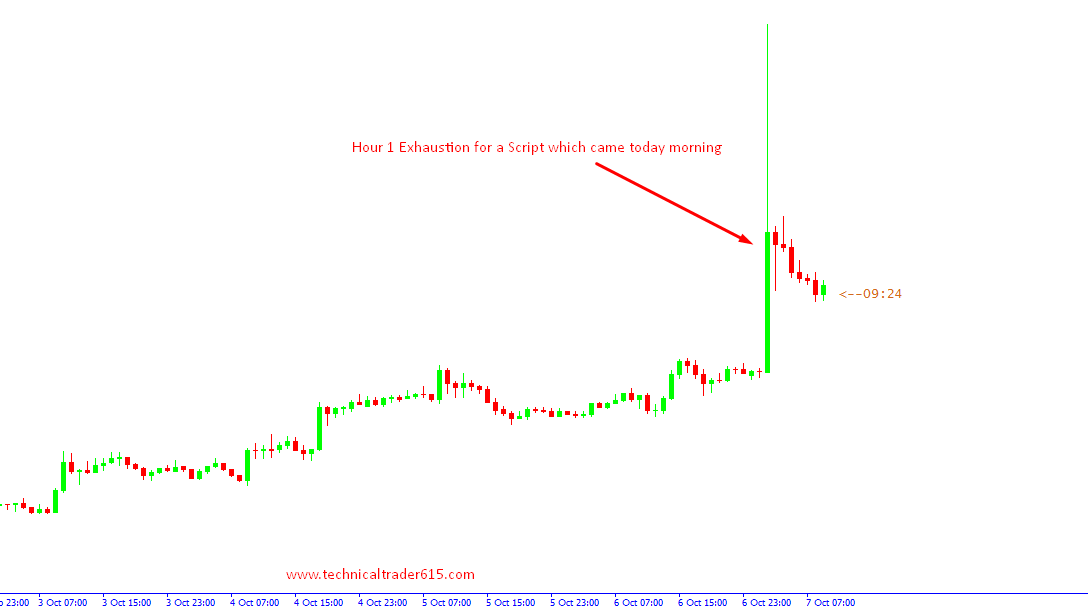
One Live Example : 1 hour time frame
The above explanations are from my basic price action course, I take one to one Advanced Price Action course. if you are interested kindly get in touch thru watsapp or you can call me at 7373339777 or at 8508777733
** Price action is not patterns (HS or dble top) nor the much misconceived Pin bar. Price action is a whole different world. please use the contact page for any feedbacks. For Regular update on my posts kindly subscribe to the newsletter column in the home page.
Thanks a lot !!!
Happy Learning and Trading !!!
Cheers....
Comments
Leave a Reply
Your email address will not be published. Required fields are marked *
No comment has been posted yet.