CRACKING THE MULTIPLE TIME FRAME STRATEGY
Posted on August 18, 2017 12:36 pm
The Biggest mistake in trading is to see and use multiple time frames to trade. Most people start with weekly charts , then they move to daily charts and then 4H,1H and then they trade lower time frame charts like 15 min or 5 min. This kind of exercise is totally irrelevant to your trading time frame. If you are executing trades based on 1 Hour, Analyze only 1 hour chart or respectively.
We will see some reasons behind it:
A) RESISTANCE OR SUPPORT IS A ZONE NOT A LEVEL
The resistance or support which we see in daily chart is not a level , it’s a zone, Which means the zone in daily charts can be 100 pts for nifty or 200 pts for Bank nifty ( for example )
Traders lockdown the Exact resistance or support number in mind and when they trade in 15 min or 1HR respectively, The moment prices hit that exact level they will look to exit and end up cutting down a Good winning trade thinking it hit EOD Resistance or support. Rather the trader should see price action happening at the trading time frame and decide. As EOD res or support is a Zone, in trading time frame prices can push strong to go beyond the zone of EOD or sometimes break it also.
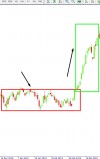
Look at the illustrations below
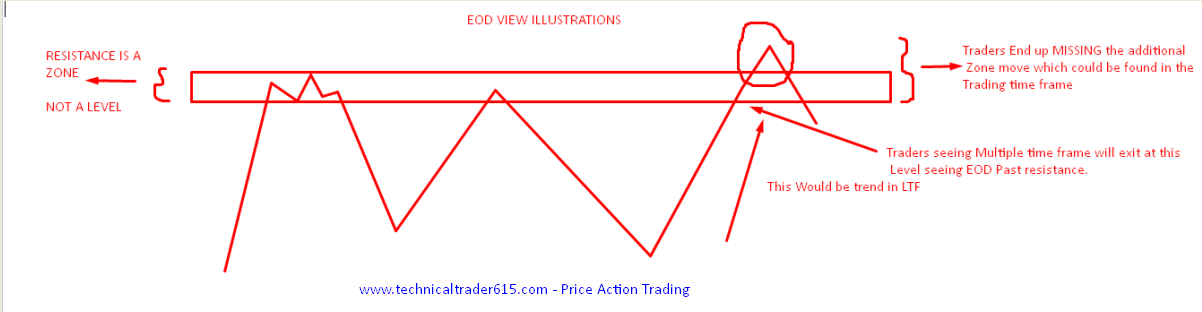
B) While you EXIT at EOD Level the RESISTANCE CAN BREAK AS EOD CANDLE IS UNDER DEVELOPMENT
The EOD candle keeps changing as more prices adds to it, which means You need the daily chart candle to close to understand about the next move, trying to utilize that unfinished candle of EOD to intraday trading or positional trading in 1Hour chart is entirely meaningless as you still don’t know if the resistance zone in daily chart is going to hold or Break until the candle closes.
The only way is to understand price action happening at the time frame you trade and see if its taking res or support at the trading time frame and not bothering about Resistance zone of HTF, if the resistance of the daily chart is broke, we would see positive price movements in your trading time frame ( it could be 15 or 30 min tf) and you can continue to hold, if prices reverse you can exit in your trading time frame.

This thought of multiple time frame does not allow you to let a winner run as you would be in a constant state of fear of a number in the Higher time frame and you don’t know if HTF is going to dominate or not. Only price action at current at the trading time frame should determine your decision.
C) Mismatched views:
Another Main issue would be mismatched views. The higher time frame chart might be trending lets say upside and it starts a pull back , A pullback in daily chart can be a trend on the opposite side on the 5 min chart. A deep pull back in daily chart is a crash in 5 min chart. The most important mistake is that people enter lower time frame thinking that they are going to connect to the up trend in daily chart, when you enter an opposite trend of the trading time frame you are sure to get your hands burnt. The only solution is to stick to the trend of the current time frame. don’t try to connect with daily chart trend. As daily chart trend correction can last for many days or can be deep or the daily chart correction turns into reversal giving you death by thousand paper cuts.
d) Wide STOP LOSS
If trade is taken based on Higher time frame, the Stop Loss level should also be based on Higher time frames. There are many aspect which cant be covered in a single article , I would discuss more in detail in my one to one Advanced Price Action course.
The Conclusion:
The Conclusion is Avoid multiple time frame view and stick to the view and Movements on the trading time frame be it 5 min or 15 min. See how prices react at current time frame to take trading decisions. To know how to read market structure in lower or trading time frame and how to see price action in LTF do take my Advanced Price Action course
Feel free to call or wats app 7373339777 to discuss more. The Price Action Advanced course is one to one. We would trade live together and not on completed charts.
Happy learning and trading.......
Cheers !!!
Comments
Leave a Reply
Your email address will not be published. Required fields are marked *

No comment has been posted yet.