Banks EOD VIEW :Short Term and Long Term
Posted on November 23, 2017 10:51 am
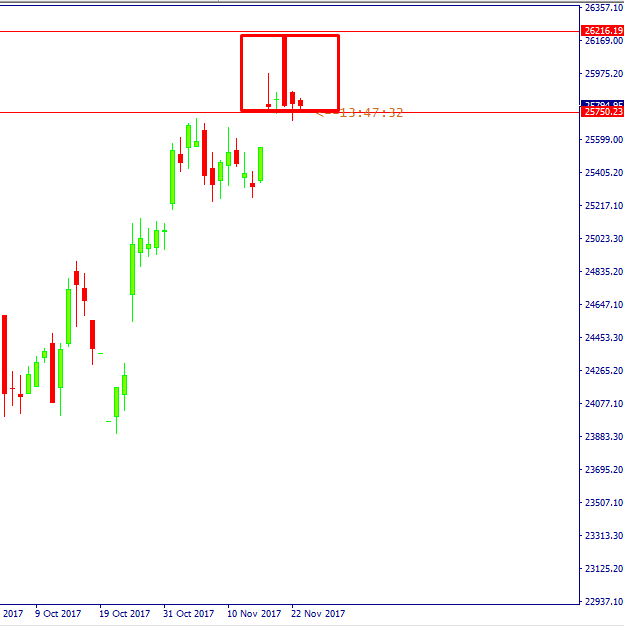
Short term view:
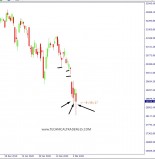
Banknifty EOD chart is in a narrow range for the last 5 days. When price candles are overlapping like the example below , we cant expect a trend move in intraday basis. We need to wait for prices to move out of the Range to take a position both swing as well as intraday. Dont tuch until the range is expanded. Else you will be just speculating !!!
Because of this prolonged consolidation the Breakout move will also be Explosive.
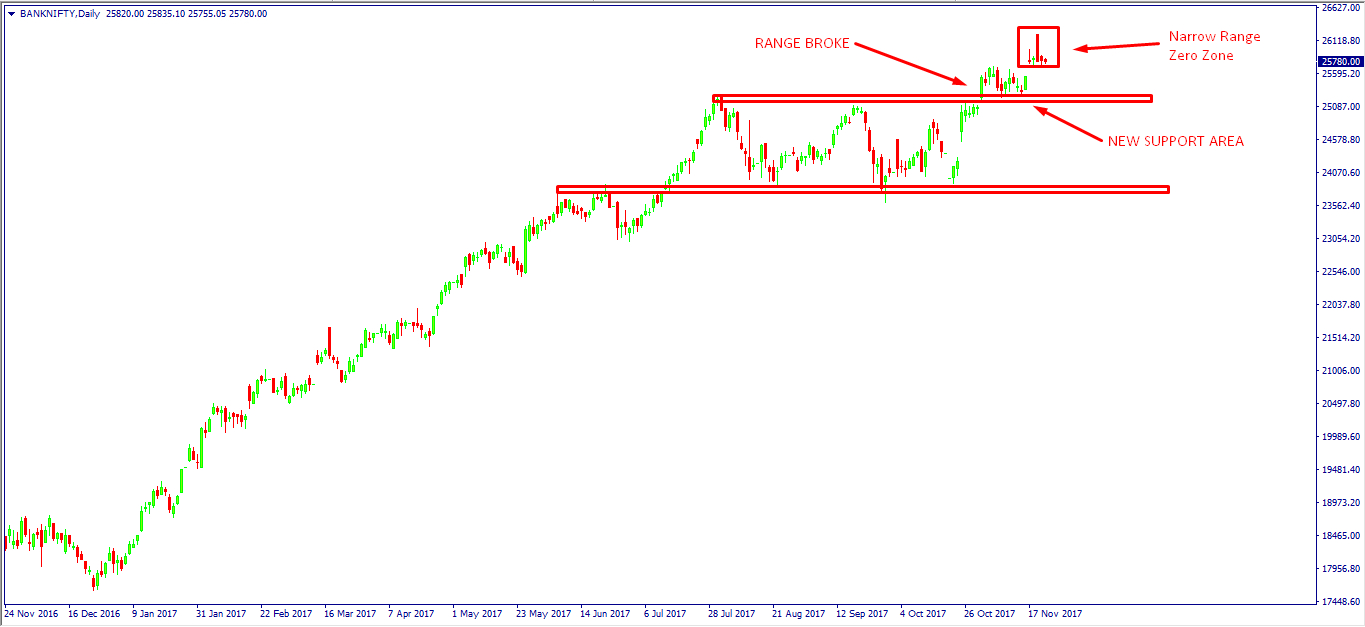
long term view:
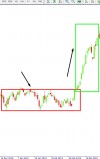
Prices was in a Trading range and it broke on upside. the minimum target is the Range trasmitting on the upside. After break it tested the Resistance turned Now support area from where the big gap occured. A follow thru is pending for prices to continue the Bull run. if prices again comes back into the previous range it would be considered as False break and we will change the strategy accordingly.
for more articles click this link below :
http://www.technicaltrader615.com/price-action/technical-chart-analysis
if you have any doubts feel free to send message in watsapp 7373339777 or you can connect in my facebook page https://www.facebook.com/technicaltrader615/
Happy Learning and Trading !!!
Cheers..
Comments
Leave a Reply
Your email address will not be published. Required fields are marked *

No comment has been posted yet.